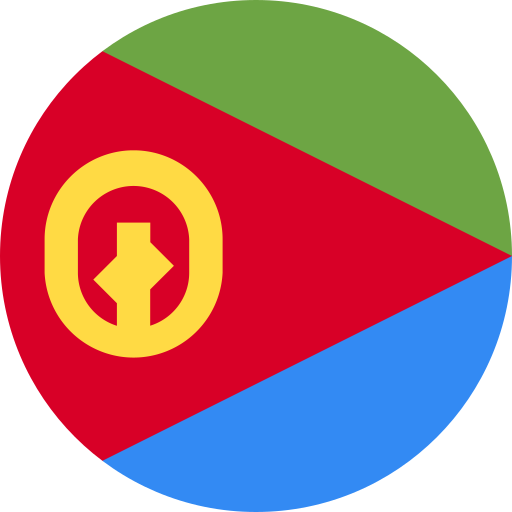
Eritrea
Sub-Saharan Africa·Low income
- Population
- 3.47M
- 132nd of 217
- GDP
- $2.07B
- 191st of 214 · 2011
- GDP per capita
- $689
- 205th of 214 · 2011
- Life expectancy
- 68.6
- 161st of 217
- Human development
- 0.492
- 174th of 189 · 2021
Benchmarked againstEritrea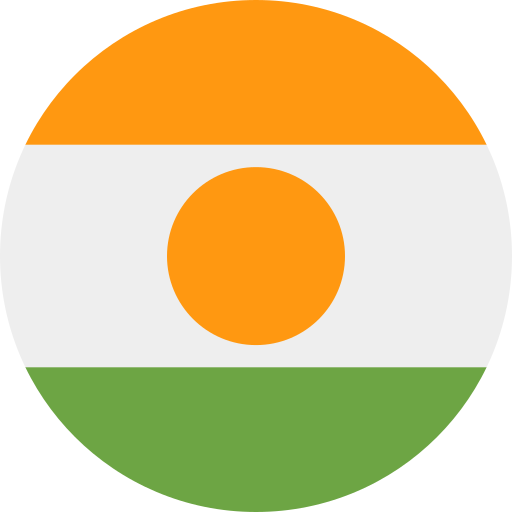 Niger
Niger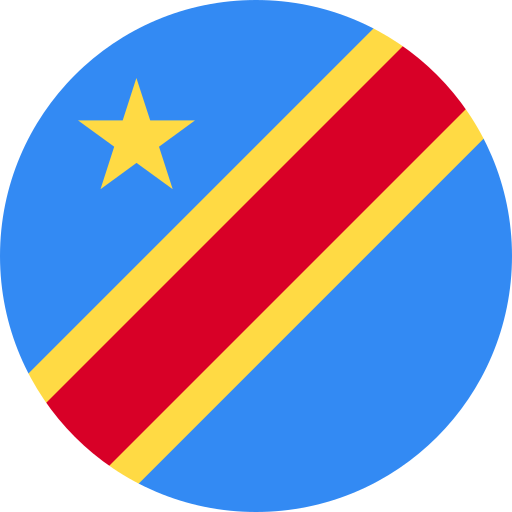 Congo, Democratic Republic of
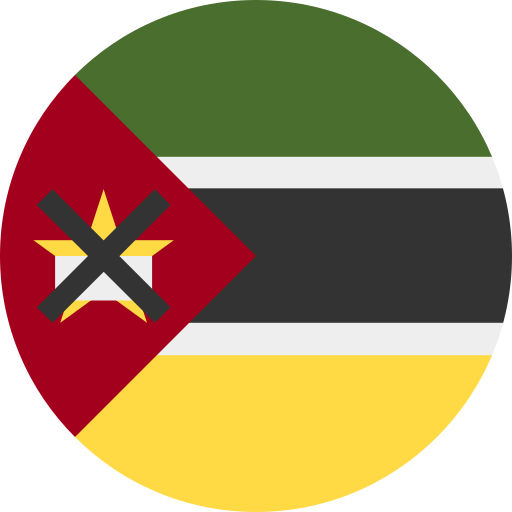 Mozambique
 Somalia
EritreaNigerCongo, Democratic Republic ofMozambiqueSomaliaDefault peers are drawn from region, income, and bloc membership — swap in any country you like. The gray tick on each strip is the world median.
largely agrarian economy with a significant mining sector; substantial fiscal surplus due to tight controls; high and vulnerable debts; increased Ethiopian trade and shared port usage decreasing prices; financial and economic data integrity challenges
- Area
- 117,600 km²
- Languages
- Tigrinya (official), Arabic (official), English (official), Tigre, Kunama, Afar, other…
- Resources
- gold, potash, zinc, copper, salt, possibly oil and natural gas, fish
- Borders
- Djibouti; Ethiopia 1,033 km; Sudan
Religion
world view →- Muslim51.7%
- Christian46.7%
- Unaffiliated1.1%
- Other0.6%
- Religious diversity
- 6.01 / 10 · high · 28th of 193
Change markers show percentage-point shifts from 2010 to 2020 · Pew Research Center, Religious Composition 2010–2020.
Score card
quartile grades among all countries with data
A · Top quartileB · Above medianC · Below medianD · Bottom quartile
TopicERINERCODMOZ
ERINERCODMOZEconomy & Trade
theme overview →People & Society
theme overview →Health & Education
theme overview →Connectivity
theme overview →Energy & Climate
theme overview →Inequality
theme overview →Governance & Democracy
theme overview →Conflict & Security
theme overview →Values & Beliefs
theme overview →Development & Wellbeing
theme overview →Explore any measure in depth on its own page — try GDP per capita or electoral democracy.